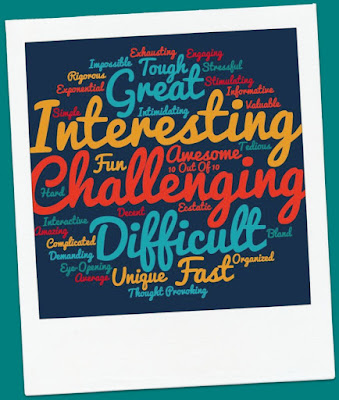
Students have responded to my "end of year" survey. I am reviewing their responses.
I borrowed Julie's idea for a word cloud ... one word description of our class ...
Students identified @Desmos as a preferred tech tool!
Partner work was a preferred instructional strategy!
Statistics I found interesting ...
61% said their confidence in their math skills improved.
56% said their concentration, work effort in class improved.
93% said their calculator skills improved; 62% said their calculator skills improved exponentially!
65% said their understanding of the "why" of concepts improved.
80% said their algebraic arithmetic skills improved.
17% said their confidence in their math skills declined this year. 22% said their confidence level stayed the same. One of my goals in my instruction is to help students believe in themselves, develop confidence in their problem solving skills, and not feel dependent on a teacher for each step. Obviously this is an area that I could strengthen.
I asked students "What was the most difficult thing for you to learn this year?" to identify the more difficult units based on students' thoughts. Those are the units that I want to review carefully this summer. How might I rework the lesson structure, the learning activities, the practice to make the content more clear for students? The units that students identified were the rationals and logs.
Last ... the statistic that feels the most personal is that only 50% rated the lessons interesting (4's and 5's on the scale). You know that feeling when you have poured your heart and soul into something ... well ... guess I hoped for a little better than half!
What do you do with end of the year data? How do you use it? What question do you find to be the most beneficial to you?

No comments:
Post a Comment